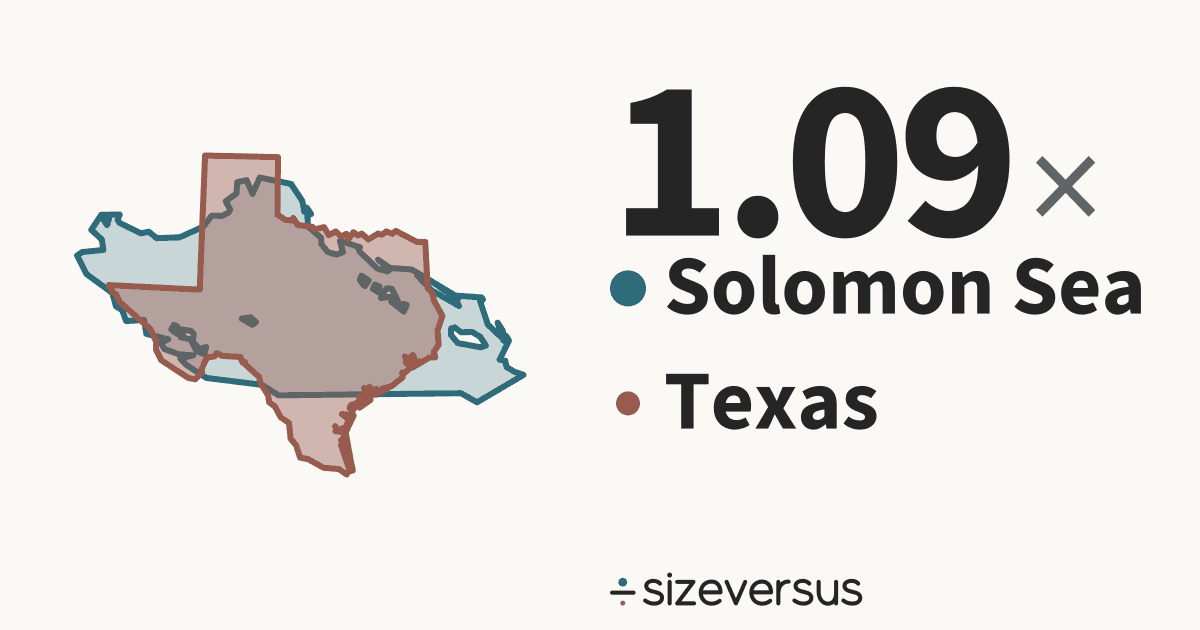
Solomon Sea is 1.09× the size of Texas
The Solomon Sea (sea) covers about 745,000 km² (288,000 mi²) and Texas (state) about 685,000 km² (265,000 mi²). Below, both outlines are drawn at one scale and centred on each other. The Solomon Sea outline is Natural Earth’s, checked against the published area.
- 745,000km²Solomon Sea
- 685,000km²Texas
500 km
- Solomon Sea
- Texas
What fits
- Texas is 92% of the size of Solomon Sea.
- Solomon Sea is larger by 59,500 km² (23,000 mi²), which is 8.7% of the area of Texas.
- Measured in Belgiums: Solomon Sea is about 24.3, Texas about 22.3.
How they differ
- Their centres are about 12,100 km apart.
- On a standard web map Texas looks larger than Solomon Sea: Solomon Sea at 9°S is drawn about 1.0× too large and Texas at 31°N about 1.4×, so the map shows Texas as 1.24× the size of Solomon Sea, when Solomon Sea is 1.09× the size of Texas.
- Together Solomon Sea and Texas cover 1,430,000 km², close to the size of Mongolia (1,565,000 km², 9.4% bigger).
- The gap between them, 59,500 km², is about the size of Togo (56,900 km²).
- Texas's centre is 40.1° of latitude, about 4,460 km, farther north than Solomon Sea's.
- The Solomon Sea is a sea and ranks 12th of the 42 seas on sizeversus by area.
- Texas is a state of the United States; it is not drawn with its waters removed, and its measured area is the Natural Earth outline's.
- Laid out flat, the Solomon Sea stretches about 837 km north to south and 1,660 km east to west; Texas about 1,190 km by 1,240 km.
- Our measured 745,000 km² is 3.5% above Wikidata’s published figure of 720,000 km². Published areas of lakes and seas move with the water level and with what is counted, so a few percent is expected.
Who wins on what
| Measure | Winner | By |
|---|---|---|
| Larger area | Solomon Sea | 1.09× |
| Farther north | Texas | 40.1° of latitude |
| Stretched more on a web map | Texas | 1.4× against 1.0× |
Both against the same yardsticks
| Yardstick | Solomon Sea | Texas |
|---|---|---|
| Belgium 30,700 km² | 24.3× | 22.3× |
| United Kingdom 244,000 km² | 3.06× | 2.81× |
| Germany 358,000 km² | 2.08× | 1.92× |
| Japan 374,000 km² | 1.99× | 1.83× |
| France 548,000 km² | 1.36× | 1.25× |
| India 3,151,000 km² | 0.24× | 0.22× |
| Brazil 8,473,000 km² | 0.09× | 0.08× |
| United States 9,447,000 km² | 0.08× | 0.07× |
| Russia 16,980,000 km² | 0.04× | 0.04× |
Each figure is the place's area divided by the yardstick's.
Side by side
| Solomon Sea | Texas | |
|---|---|---|
| Is a | Seasea on sizeversus | StateUnited States |
| Area, measured | 745,000 km²288,000 mi² | 685,000 km²265,000 mi² |
| Area, published | 720,000 km²Wikidata | 696,000 km²Wikidata |
| Rank by area | 12th of 42seas | – |
| Greatest depth | 9,140 mWikidata | – |
| Latitude range | 12°S to 4°S | 26°N to 37°N |
| On the shore | 2 on the shore | – |
Published figures: Wikidata (CC0). A lake or a sea has no legal boundary: the measured area is that of Natural Earth’s outline, and it is shown beside the published one.
- Natural Earth’s outlines of Papua New Guinea and the Solomon Islands lie within 25 km of the outline of the Solomon Sea. That is what its geometry says, and it is not a statement about who owns the water or where any border runs in it.
Similar in size to Solomon Sea
Similar in size to Texas
More comparisons
Send it to someone who won’t believe it

Sources and method
- Outlines
- Lakes and seas: Natural Earth 1:10m physical vectors (public domain), kept only where the measured area is within 10% of the published one. Countries and regions: Natural Earth, 1:10m Admin 0 and Admin 1, public domain.
- Boundary
- De facto, as drawn by Natural Earth. A lake or a sea has no legal boundary of its own; the outline is a cartographic one.
- Area
- Measured on the WGS84 ellipsoid from the full-detail outlines, shown rounded. The published figure comes from Wikidata (CC0), fetched 2026-11-11, and is shown beside the measured one.
- Drawing
- Each outline is projected with an equal-area projection centred on its own centroid, so areas stay true and the two can be laid over each other.
- Data built
- 2026-11-11