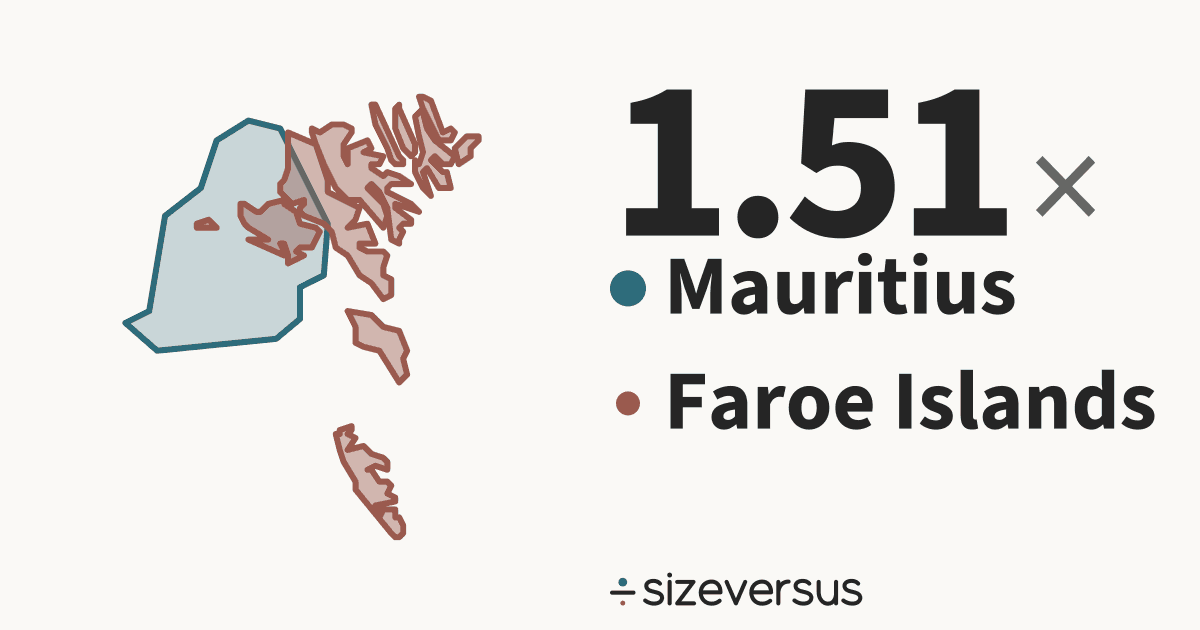
Mauritius is 1.51× the size of Faroe Islands
Mauritius covers about 2,000 km² (772 mi²) and Faroe Islands about 1,330 km² (513 mi²). Below, both outlines are drawn at one scale and centred on each other.
- 2,000km²Mauritius
- 1,330km²Faroe Islands
200 km
- Mauritius
- Faroe Islands
Outlines show main territory. Mauritius also has about 14 km² of overseas territory. These are not drawn, and not counted in the comparison.
What fits
- Faroe Islands is 66% of the size of Mauritius.
- Mauritius is larger by 672 km² (259 mi²), which is 51% of the area of Faroe Islands.
- Measured in Belgiums: Mauritius is about 0.07, Faroe Islands about 0.04.
How they differ
- Mauritius also has the larger population: 1.3 million against 54,000, 23.4× as many people.
- Per square kilometre that is 628 in Mauritius against 41 in Faroe Islands: Mauritius is 15.4× as densely populated.
- Their centres are about 10,800 km apart.
- On a standard web map Faroe Islands looks larger than Mauritius: Mauritius at 20°S is drawn about 1.1× too large and Faroe Islands at 62°N about 4.6×, so the map shows Faroe Islands as 2.66× the size of Mauritius, when Mauritius is 1.51× the size of Faroe Islands.
- Together Mauritius and Faroe Islands cover 3,330 km², close to the size of Turkish Republic of Northern Cyprus (3,320 km², 0.3% smaller).
- The gap between them, 672 km², is about the size of Bahrain (688 km²).
- At Faroe Islands's density, Mauritius would have 82,000 people (it has 1.3 million). At Mauritius's density, Faroe Islands would have 834,000 (it has 54,000).
- Faroe Islands's centre is 82.3° of latitude, about 9,150 km, farther north than Mauritius's.
Who wins on what
| Measure | Winner | By |
|---|---|---|
| Larger area | Mauritius | 1.51× |
| More people | Mauritius | 23.4× |
| More crowded | Mauritius | 15.4× |
| Farther north | Faroe Islands | 82.3° of latitude |
| Stretched more on a web map | Faroe Islands | 4.6× against 1.1× |
Both against the same yardsticks
| Yardstick | Mauritius | Faroe Islands |
|---|---|---|
| Belgium 30,700 km² | 0.07× | 0.04× |
| United Kingdom 244,000 km² | 0.01× | 0.01× |
| Germany 358,000 km² | 0.01× | 1 in 269 |
| Japan 374,000 km² | 0.01× | 1 in 281 |
| France 548,000 km² | 1 in 274 | 1 in 412 |
| India 3,151,000 km² | 1 in 1,575 | 1 in 2,372 |
| Brazil 8,473,000 km² | 1 in 4,235 | 1 in 6,378 |
| United States 9,447,000 km² | 1 in 4,723 | 1 in 7,111 |
| Russia 16,980,000 km² | 1 in 8,488 | 1 in 12,781 |
Each figure is the place's area divided by the yardstick's.
Side by side
| Mauritius | Faroe Islands | |
|---|---|---|
| Area, main territory | 2,000 km²772 mi² | 1,330 km²513 mi² |
| Area with overseas territory | 2,010 km² | 1,330 km² |
| Population | 1.3 millionWikidata, 2017 | 54,000Wikidata, 2023 |
| Density | 628 per km² | 41 per km² |
| Official area | 2,040 km²Wikidata | 1,400 km²Wikidata |
| Capital | Port Louis | Tórshavn |
| Latitude range | 21°S to 20°S | 61°N to 62°N |
| Continent | Seven seas (open ocean) | Europe |
Population: Wikidata 2017 and Wikidata 2023, covering each whole country. Official figures: Wikidata (CC0).
- Wikidata's official figure of 2,040 km² agrees with our measured area of 2,010 km², to within 2%.
- Our measured 1,330 km² is 5.0% below Wikidata's official figure of 1,400 km². Official figures can include inland water or count land that an outline draws differently. This difference is flagged for review.
Similar in size to Mauritius
Similar in size to Faroe Islands
More comparisons
Send it to someone who won’t believe it

Sources and method
- Outlines
- Natural Earth, 1:10m Admin 0 - Countries, public domain
- Boundary
- De facto, as drawn by Natural Earth. Main territory: the largest landmass and every part within 1,000 km of it.
- Area
- Measured on the WGS84 ellipsoid from the full-detail outlines, shown rounded. Comparisons use main-territory area.
- Drawing
- Each outline is projected with an equal-area projection centred on its own centroid, so areas stay true and the two can be laid over each other.
- Data built
- 2026-11-11