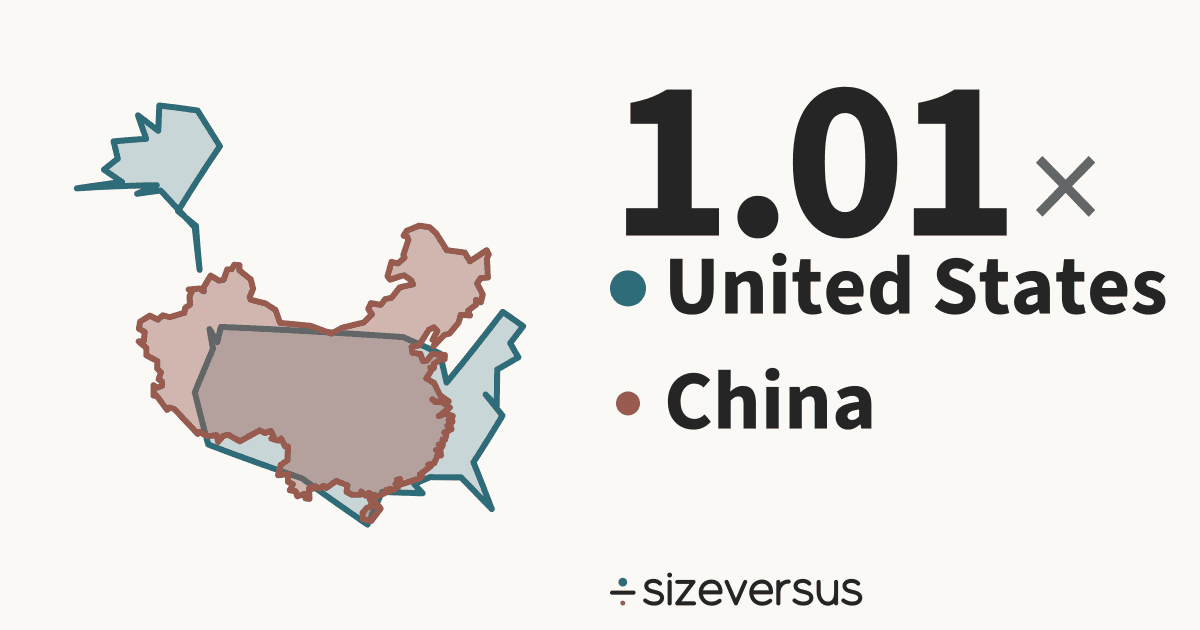
United States is 1.01× the size of China
United States covers about 9,447,000 km² (3,648,000 mi²) and China about 9,375,000 km² (3,620,000 mi²). Below, both outlines are drawn at one scale and centred on each other.
- 9,447,000km²United States
- 9,375,000km²China
2,000 km
- United States
- China
What fits
- China is 99% of the size of United States.
- United States is larger by 72,200 km² (27,900 mi²), which is 0.8% of the area of China.
- Measured in Belgiums: United States is about 308, China about 306.
How they differ
- United States is larger, but China has the larger population: 1.40 billion against 340.1 million, 4.13× as many people.
- Per square kilometre that is 150 in China against 36 in United States: China is 4.17× as densely populated.
- Their centres are about 10,600 km apart.
- A standard web map misstates the comparison: United States at 45°N is drawn about 2.0× too large and China at 37°N about 1.6×, so the map shows United States as 1.29× the size of China instead of 1.01×.
- Together United States and China cover 18,823,000 km², close to the size of Russia (16,980,000 km², 9.8% smaller).
- At China's density, United States would have 1.42 billion people (it has 340.1 million). At United States's density, China would have 336.9 million (it has 1.40 billion).
- United States's centre is 8.1° of latitude, about 900 km, farther north than China's.
Who wins on what
| Measure | Winner | By |
|---|---|---|
| Larger area | United States | 1.01× |
| More people | China | 4.13× |
| More crowded | China | 4.17× |
| Farther north | United States | 8.1° of latitude |
| Stretched more on a web map | United States | 2.0× against 1.6× |
Both against the same yardsticks
| Yardstick | United States | China |
|---|---|---|
| Belgium 30,700 km² | 308× | 306× |
| United Kingdom 244,000 km² | 38.8× | 38.5× |
| Germany 358,000 km² | 26.4× | 26.2× |
| Japan 374,000 km² | 25.3× | 25.1× |
| France 548,000 km² | 17.2× | 17.1× |
| India 3,151,000 km² | 3.00× | 2.98× |
| Brazil 8,473,000 km² | 1.12× | 1.11× |
| Russia 16,980,000 km² | 0.56× | 0.55× |
Each figure is the place's area divided by the yardstick's.
Side by side
| United States | China | |
|---|---|---|
| Area, main territory | 9,447,000 km²3,648,000 mi² | 9,375,000 km²3,620,000 mi² |
| Population | 340.1 millionWikidata, 2024 | 1.40 billionWikidata, 2025 |
| Density | 36 per km² | 150 per km² |
| Official area | 9,834,000 km²Wikidata | 9,563,000 km²Wikidata |
| Capital | Washington, D.C. | Beijing |
| Latitude range | 25°N to 71°N | 16°N to 54°N |
| Continent | North America | Asia |
Population: Wikidata 2024 and Wikidata 2025, covering each whole country. Official figures: Wikidata (CC0).
- Our measured 9,464,000 km² is 3.8% below Wikidata's official figure of 9,834,000 km². Official figures can include inland water or count land that an outline draws differently.
- Wikidata's official figure of 9,563,000 km² agrees with our measured area of 9,375,000 km², to within 2%.
Similar in size to United States
Similar in size to China
More comparisons
Send it to someone who won’t believe it

Sources and method
- Outlines
- Natural Earth, 1:10m Admin 0 - Countries, public domain
- Boundary
- De facto, as drawn by Natural Earth. Main territory: the largest landmass and every part within 1,000 km of it.
- Area
- Measured on the WGS84 ellipsoid from the full-detail outlines, shown rounded. Comparisons use main-territory area.
- Drawing
- Each outline is projected with an equal-area projection centred on its own centroid, so areas stay true and the two can be laid over each other.
- Data built
- 2026-11-11